What's new:
The structure and information of our daily forecasts has not changed. Here’s what’s new this season:
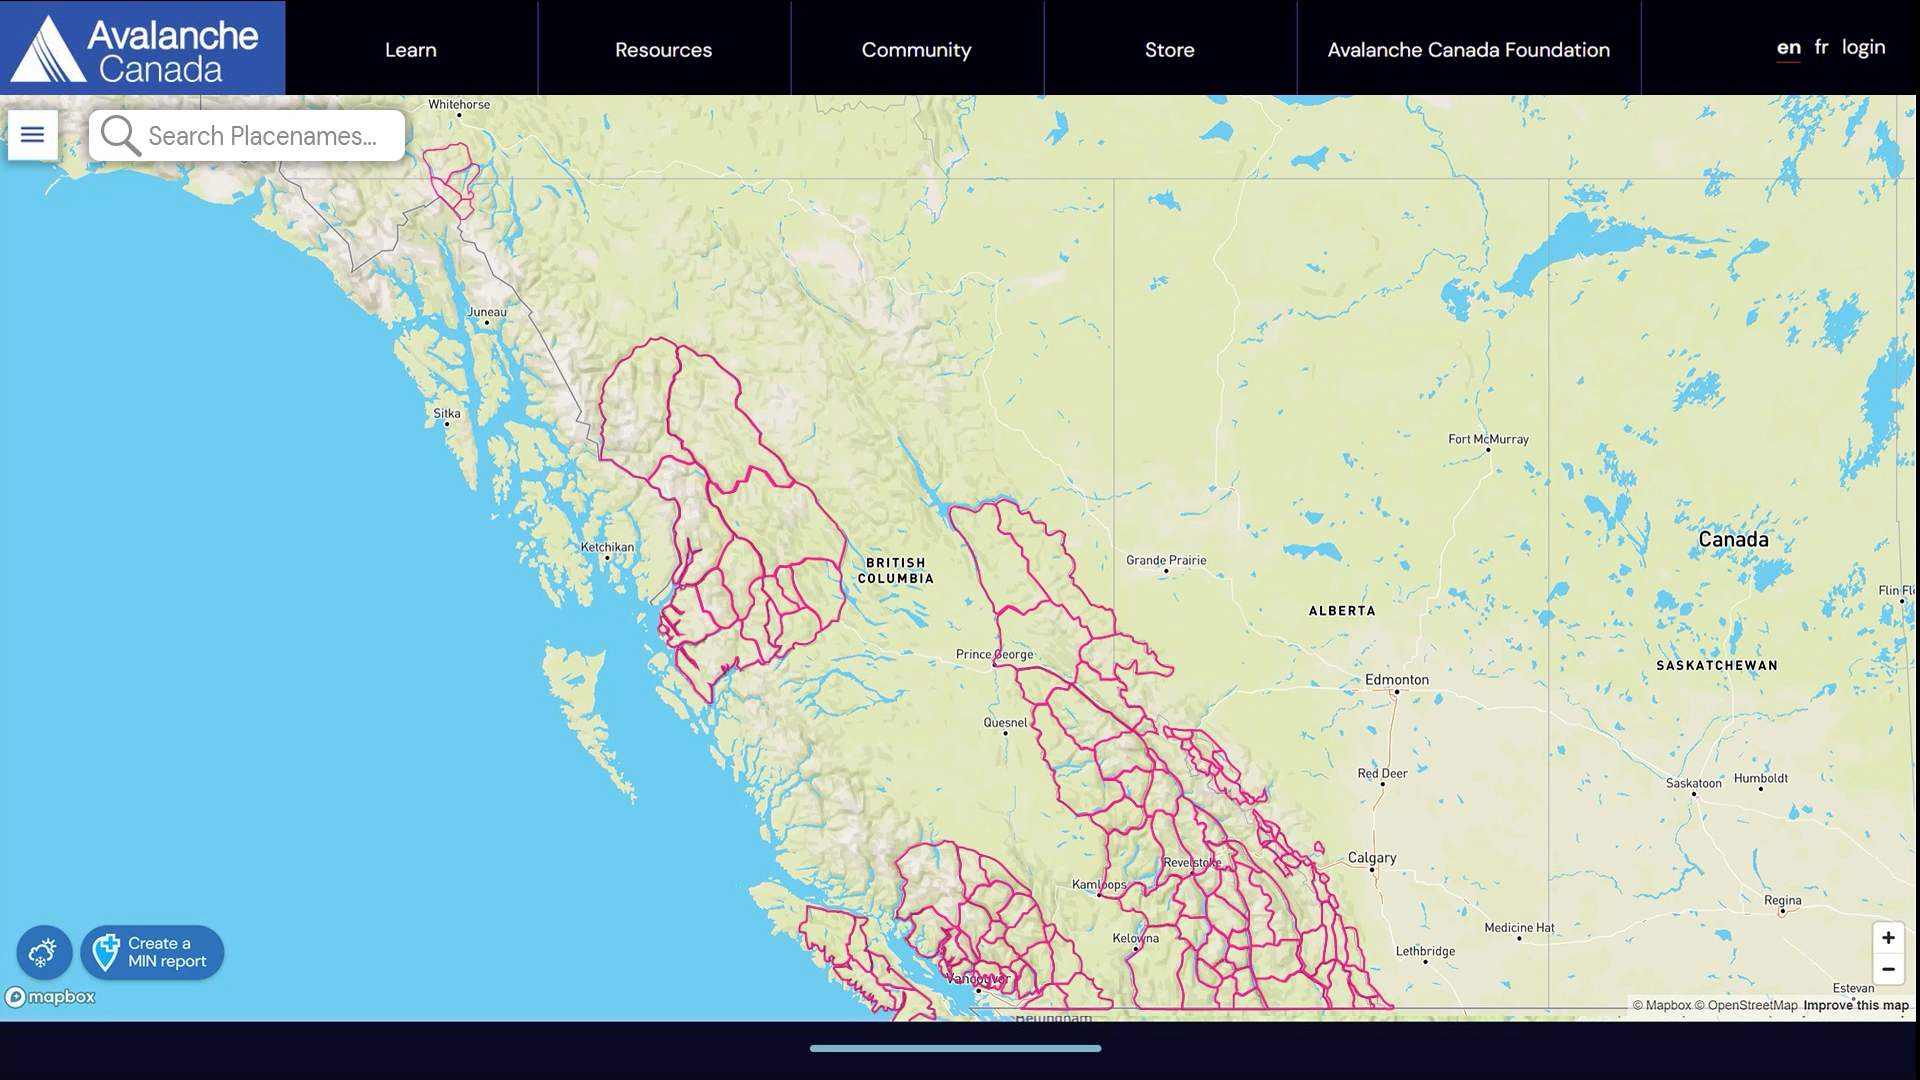
- Our homepage map has a new search feature so you can find your riding areas quickly and easily.
- Each forecast region is coloured to reflect its highest danger rating.
- While we are covering the same area we always have, the forecast regions are now dynamic, with boundaries that change in response to conditions.
- Our forecasters determine the regional boundaries every day. There are no longer fixed forecast regions or region names.
This new system allows our forecasts to more accurately reflect backcountry conditions as our regions are now determined by the avalanche conditions. We’ve made these changes to tackle one of our biggest problems with our old system, where conditions would often vary significantly across some of our larger regions.
At times, you might see regions of the same colour separated into different forecasts. This means the highest danger rating is the same across these two regions, but the avalanche problems are different.
We’re excited about these changes and we’re confident they will provide a better experience for our users.
To learn more about our new forecasting system, check out this video and our Q&A section below.
Why did you change the forecast?
The structure and information of our daily forecasts has not changed. You can expect the same information and detail as always, just tailored more closely to your recreation area. What has changed is the way users find their regional forecast. We’ve added a search bar, a tool familiar for anyone who’s used google maps or any online map function. This allows you to quickly and easily find your riding area on the map along with the corresponding avalanche forecast.
While we’re covering the same large area that we always have, the size and shape of our regions are now determined by the avalanche conditions. This new system enables us to provide more accurate forecasts when weather cycles impact some areas but not others.
How do I find my forecast?
To find your forecast, enter a place name, like your backcountry skiing, snowmobiling, snowshoeing, or climbing destination, in the search bar. The map will centre on that location and display the daily forecast for that region. You can also navigate on the map to find your area, like you would on other online map applications.
What if my destination is on the border between two regions?
If your destination is on the border between two regions, consult the avalanche forecast for both regions to get a comprehensive understanding of the avalanche problems. Just like with the old system.
What happens if you have adjacent regions with the same danger but different forecast problems?
Sometimes adjacent regions will have the same colour but have a border between them. This indicates the highest danger rating is the same for both regions, but the information in the avalanche forecast—specifically the avalanche problems—are different.
How do I see the danger ratings for each of the three elevation zones?
The regions are coloured to reflect the local danger rating. These colours correspond to the North American Public Avalanche Danger Scale. When opened, the forecast will still provide three danger ratings, reflecting the three elevation zones. The region’s colour will be the highest danger rating of the three.
How do you decide regional boundaries every day?
Creating avalanche forecasts relies on a good understanding of the regional snowpack and the incoming weather patterns. Our forecasters gain knowledge about the snowpack using a variety of tools and data sources. They develop the forecast based on the current conditions and the incoming weather. . Using our forecasting software, subregions with similar conditions are grouped together to form a daily forecast region. This is our first season working with the 92 subregions and may evolve over time.
Why did you get rid of the old regions?
With our old, fixed regions, we would often see significant variation in the snowpack and weather patterns within one region. Applying one forecast to a region that had big differences within its boundaries was a communication challenge. This new system enables us to provide more accurate forecasts when weather cycles impact some areas but not others. Now, our forecasters can more effectively communicate that variability. Also, the new search bar feature makes it easier for users to determine which forecast regions are applicable to them.
How did you determine the boundaries for the subregions?
Our forecasters were tasked with creating smaller subregions that would allow forecasts to better reflect conditions. To determine the subregions, the forecasting team considered criteria such as snow climate, weather patterns, use patterns, and access routes. Analyzing this data resulted in 92 subregions.
About subregions
You won't see these on the map, but these 92 subregions are the foundation of our new flexible forecast regions. Every day, forecasters will group subregions with similar conditions to create a forecast region.
We established the boundaries of our subregions on the basis of snowpack and weather characteristics. We then refined those boundaries on the basis of user patterns, with the intent to avoid separating popular riding areas into different regions or separating riding areas from their access.
These subregions are the first iteration and might well change as we get into the forecasting season.
The Long Range Mountains in western Newfoundland have also been split into three subregions, not pictured below.